
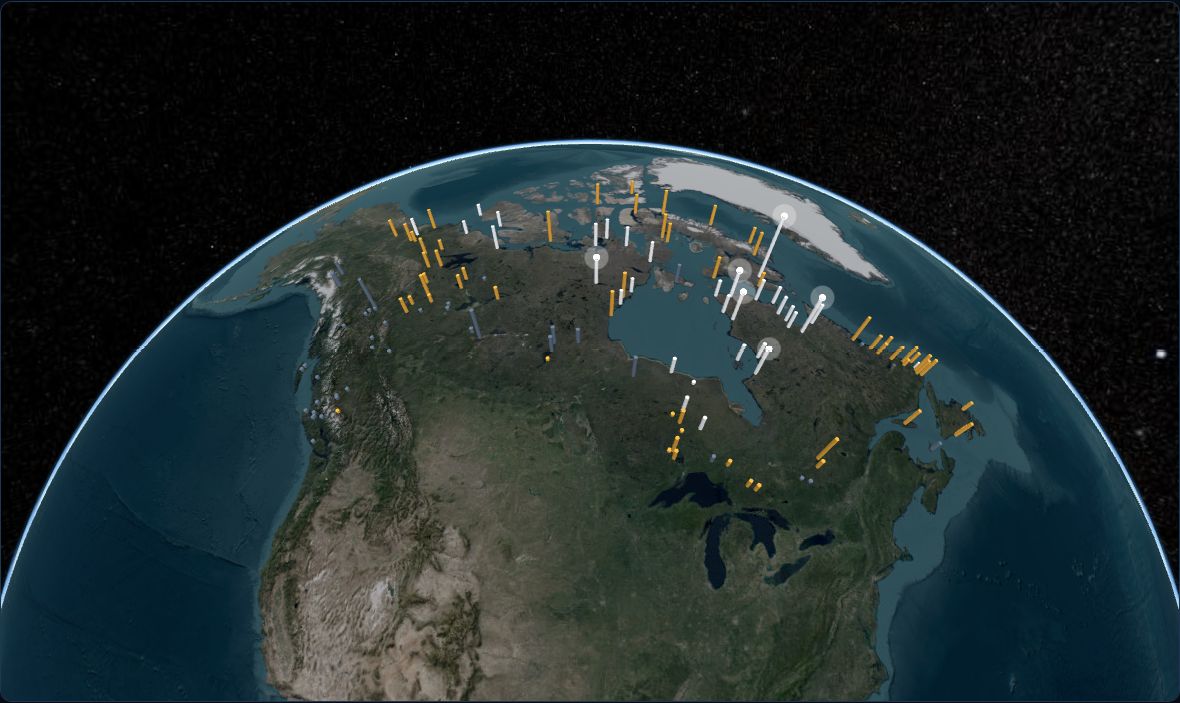
Your browser can't run the 3D globe, so this is a still of it. Open it in Chrome, Safari, Edge or Firefox to fly the globe.
LOADING GLOBE
Your browser can't run the 3D globe, so this is a still of it. Open it in Chrome, Safari, Edge or Firefox to fly the globe.
138 Canadian communities run mainly on diesel
Sized for a megawatt-scale unit like CSMC's POLAR-1. Of the 100 diesel communities that report load, only 13 average a megawatt or more. At $0.30/kWh, Iqaluit alone is half of the 1 MW units. The biggest single loads are mines, and the defence sites cluster at the largest towns.
Set a price and a unit size. White bars are where diesel fuel alone costs more; glowing ones have the average load for a whole unit.
| # | Community | Utility today | Average load | Units | Fuel cost per kWh | Fuel cost displaced a year (max) | Runway | Defence within 30 km |
|---|
Click a row to fly there. Units are average load divided by unit size, rounded down. Load swings by hour and season, so these units would run at part load some of the time and peaks stay on diesel; fuel cost displaced (units × unit size × 8,760 hours × fuel cost per kWh) is an upper bound. C-17 marks runways at least 3,500 ft long and 90 ft wide, the shortest the US Air Force says a C-17 can use; POLAR-1 is built to fly on one. Length and width only: surface strength and payload aren't checked. Four of the six default rows are in Nunavik, where all 13 plants share one regional fuel price ($1.40/L).
| Mine | Operator | Status | Installed diesel capacity |
|---|
Off-grid mines in the territories, Nunavik and Labrador. Capacity is installed generation, not average load (mines run close to flat out, but it isn't the same number as the community loads above). It's from NRCan's 2018 database unless a newer company or permit figure exists; open a mine's card for its source. Statuses are the latest public news as of October 2026.
| Community | Defence within 30 km | Average load | Fuel cost per kWh |
|---|
Each bar is one of the 138 communities NRCan lists as running mainly on diesel. Bar height scales with annual generation.
Fuel cost per kWh is the community's 2018 fuel price divided by 3.75 kWh per litre, Qulliq Energy's fleet average. It counts fuel only, so the full cost of power is higher. The 2018 prices are a floor: switch to "Scaled +26%" for a rough present-day view.
94 communities have a usable fuel price and 87 also report generation. Five 2018 prices under $0.60/L (Watson Lake, Destruction Bay, Gilford Island, Knight Inlet and Owikeno) look like errors and are left out.
Heating oil isn't counted. A unit that sells heat as well as power has more diesel to displace than this map shows.
This method puts 24 of Nunavut's 25 diesel plants at $54.6M of fuel a year at 2018 prices (Coral Harbour has no price on file). Qulliq Energy budgets $70.0M of fuel for 2025/26. Most of the gap is price: Qulliq's budget works out to about $1.42/L on NRCan's generation figures, against $1.13/L in the 2018 data.
Fuel is only 38% of Qulliq's costs ($70.0M of a $183.9M revenue requirement), so the price a unit really has to beat is higher than fuel alone. Not all of the rest goes away when the diesel does.
Built by Ryan Poirier on public data. Globe by CesiumJS with Google satellite imagery. Opening flight rendered in Google Earth Studio (imagery: Vexcel Imaging US, Inc., Landsat / Copernicus, Airbus, CNES / Airbus, NOAA; data: SIO, NOAA, U.S. Navy, NGA, GEBCO).